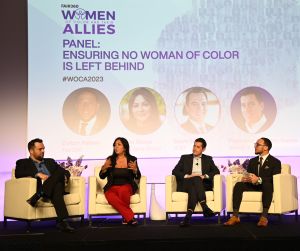
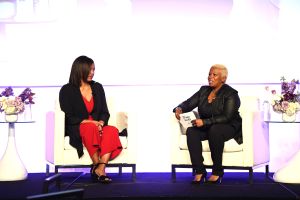
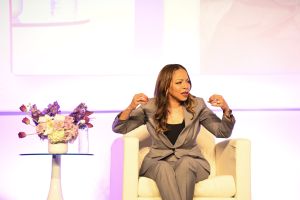
During Fair360, formerly DiversityInc’s 2021 virtual event “Improving Corporate Culture Through DEI Analytics,” panelists came together to discuss the importance of DE&I and data transparency in the modern corporate world. Panelists for the session included Belinda Grant-Anderson, Vice President of Talent Development and Diversity at AT&T (a Fair360, formerly DiversityInc Hall of Fame Company); Dr. Alveda Williams, Corporate Director of Inclusion and Senior HR Director of Talent Acquisition at Dow (No. 19 on The Fair360, formerly DiversityInc Top 50 Companies for Diversity list in 2021); Marcelo Barthollo, Americas Deputy Vice Chair of Counseling at EY (a Fair360, formerly DiversityInc Hall of Fame Company); and Stephen Lewis, General Manager of Diversity and Inclusion at Toyota Motor North America (No. 7 in 2021). Carolynn Johnson, CEO of Fair360, formerly DiversityInc, moderated the session. Here’s a look back at their conversation.
Johnson: Diversity, equity and inclusion are more than buzzwords, or corporate values to aspire to. These essential ideas are concepts that now drive overall profitability and success in today’s economic world. It’s almost impossible to find a company that doesn’t talk DE&I as a business priority goal. That’s why it is now more important than ever before. And this panel will explain how monitoring, analyzing and tracking your analytics can lay the groundwork needed to not only have a diverse workforce but also create an inclusive workplace culture that performs at its absolute peak.
Welcome everyone, and thank you all for joining us today.
So, the first question, and I’m going to ask you, Alveda, to start: Why is data so important to support an inclusive workplace culture?
Williams: Hey, Carolynn, great to see you, and let me just say thanks to you and to Fair360, formerly DiversityInc for the work you do every day to help companies elevate on this DE&I journey. To your question, I think you know a lot about Dow, you spent some time with us, but for the audience, Dow is a material science company. And so at our very core, we are a company of scientists and engineers. And so we fundamentally believe in the power and the strength and the truth, if you will, that data holds. Like so many other organizations, we use data to drive all the decisions that we make, business decisions like where we’re going to invest, innovation decisions like which products we’re going to take to market. And what I love is that, when it comes to our people and to our culture, we treat it no differently than any other business imperative.
In this space, data is still foundational for us. It is a being that provides us the hard truth and, really, the challenges around making sure we have good data in this space because when we have good data and the ability to track it, that is what is critical to accelerating progress. You know this, we know this — that we can’t change what we don’t measure. And I think you highlighted it in your opening to your question, why is data so important? I think data helps us, first of all, to identify opportunities. It helps us to quantify our progress, and sometimes, whether we like the answer or not, it helps to hold us accountable. And listen, there are a number of examples, I think, that we could use that speak to this, but I’ll share one that we are most passionate about at Dow.
And that’s really around our Employee Resource Group participation. ERGs are, for us, the core to our strategy. They are a catalyst for cultivating an inclusive workplace culture at Dow. And so one of the things we do is, we measure participation. That is, we track the number of employees who are actually registered or signed up. And the goal for us is not to get 100% of our people in ERGs. We believe in the business case, but it really is about making sure that anyone who wants to participate can. And so, because we’re actually carefully tracking the data, we can identify opportunities. We understand where barriers to participation exist in the organization. And we’re able to put some specific actions in place to close any gaps. Because we’re monitoring the data, we know how we’re doing. We know that over the last three years, we’ve been able to triple participation in our ERGs.
And that’s a great thing for us, but that’s not the point. What is more important is that, through the data, we’ve actually been able to demonstrate why this is so important as it relates to building a culture of inclusion. I mean, we have literally, through the data, Carolynn, been able to prove out the business case for ERGs. When we actually look behind the curtains of our employee survey, we can actually see in the data that those employees who participate in our ERGs experienced 10 percentage points higher overall satisfaction with our company than those people who do not.
And then there’s the accountability piece. Like so many other companies, we measure accountability. We actually link IND metrics to what we call the performance award. Other companies call it the bonus. And we do that now for all leaders in our company. And because this ERGP is so important to us, it’s one of the few metrics that is included in that bonus structure. And so, that’s just one example, I think, of how data is not only important but can be a powerful tool in supporting the strategy and helping to build an inclusive workplace.
“By putting that data out and making it visible to the entire organization, it really holds you accountable.”
— Belinda Grant-Anderson, VP, Talent Development and Diversity, AT&T
Johnson: Awesome. I just want to dig into something that you just said, because you said other organizations call it a bonus, but we call it a performance indicator. So can you just speak to that a little bit more?
Williams: Sure. So we have a performance award design, which is essentially an annual bonus structure for our company. As a part of that design, we have actually embedded ESG metrics, and those ESG metrics relate to customer experience, sustainability and our inclusion and diversity metrics. And in terms of accountability, we drive our IND perspective by [linking] the metrics to the bonus for every leader of people in our company and every person that is a senior director and above. And so, of course, we look at things like workforce representation, but to balance that out, we also include things like ERG participation as well. So we know that accountability galvanizes action, and we want to have a bit of the carrot, but also make sure we drive the right behaviors through the performance award design.
Johnson: Awesome. And I’m going to underline “drive the right behaviors,” because that’s extremely important.
Williams: Right behaviors. That’s our key.
Johnson: So, Marcelo, can we talk about how you leverage data to promote fairness and equity in your organization? And can you define for us — because I think a lot of people have different definitions — can you define what fairness is and what equity is, and how you’re looking at your strategy?
Bartholo: Yes, thank you. Maybe I’ll start with the definition. At the end of the day, I think all of the companies that we work with, all of our clients, they really think about diversity, and it’s fairly easy to measure diversity, I think, in an organization. I think measuring fairness and equity is a much more difficult challenge. And I’ll talk a little bit about how we go about doing that here within EY. For us as a professional services organization, our talent is really the most important asset we have. We hire, try to inspire, and develop people to do great things, and we have great clients — many of whom are represented on this panel today. So, at the end of the day, everything we’re talking about here today is, for us, a business imperative for the continued success of the firm.
And we monitor data in two different ways. I think of them as leading and lagging indicators of how we’re doing in this space. We have leading indicators, like our global people survey, for example, that we run annually. And that gets at understanding the engagement of our workforce, our people. The feeling of belonging, which is really important for us, and how they feel about being at EY in the experiences that they have. And on a quarterly basis, we’ll augment that by doing a “people pulse,” where we really get a feel for the business — what are our people thinking? And what are some of the different actions we have to take to make any adjustments, whether it’s to our programs, the experiences that we’re driving, the training that we’re providing? It gives us an opportunity, frankly, to see things before they happen.
We also have the ability to monitor lagging indicators, like a turnover in promotions. On the topic of equity, for example, we look at promotions against supply. So if women represent 40% of a specific practice workforce, how are our promotion rates compared to that supply? And it tells us: Are the outcomes that we’re driving in line with our expectations as a business? And at the end of the day, we are able to cut all of this data that I’m talking about by office, by practice, by ethnic group. We can look at it and understand, early on in a process, “Wait, we’re not seeing the level of promotions here that we would expect, or the experiences that a particular group is having in a particular part of the business is different from the rest of the population, what’s going on?” And this gives us an ability to really look into — I’ll call it “under the hood” of — the business and make some adjustments as we go along.
“[We make it] very clear that there’s complete confidentiality… You have to communicate that, you have to hammer it home, time after time, year after year, that this is anonymous. This is your chance to say what you really think.”
— Stephen Lewis, GM, Diversity and Inclusion, Toyota Motor North America
Johnson: I want to dig into one of the things that you said. So, if I heard you correctly, you said, “We look at it by office,” right? And we’re specifically talking about promotions. So can you talk about “by office”? How detailed are you looking at this? And who has access to that information? Because I think that’s extremely important when we’re talking about transparency.
Bartholo: Yeah, great question. We look at it as an accounting firm and a consulting firm — and as you can probably imagine, we love numbers. We look at numbers in any which way we can. What’s important to note, Carolynn, is that the personal information is protected. Meaning, we cannot get to the individual. We don’t know what Marcelo said in any of these surveys, or any of the information that we have, but we can tell based on Marcelo’s demographic and his office and the practice it sits in — we normalize that data and look at it. And we look at it by office. We look at it by practice. We look at it by competency within a practice. We can look at it by geography in terms of a region. And we do look at that data and look for trends across all of those different cuts.
And we do it for each ethnic group. We do it for gender, and it really gives us a great window. You can look at something and say — and I’ll pick on my home office — “Why is it that turnover in Philadelphia seems to be off for this particular part of our population?” And it allows us to be able to go dig into it and have conversations with our leaders to say, “Hey, we’re seeing something here that is likely to become an issue,” because turnover, for example, is spiking in this particular location. So this gives us an incredible amount of insight into the business. And it goes back to my comment earlier, about this allowing us to make some decisions before we actually see challenges, and take advantage of specific opportunities.
The other big thing you see is an ability to then dig into, what are the leading practices? Why is it that Philadelphia has a great track record with this particular population or this particular part of the business? What can we learn from that particular office? And then drive that across the rest of the firm.
Johnson: I love it. Thank you for digging into that for me, I appreciate it. Now, Stephen, can you speak to us about why measuring for diversity is easier than measuring inclusion? And how that can be more challenging? And also, how do you measure corporate culture at Toyota?
Lewis: You’re absolutely right, Carolynn, measuring for culture and measuring for inclusion are a lot harder than measuring diversity. And so I think my advice to anybody who’s starting down this path would be, I would start with an annual employee survey. It should be at the same time every year, the questions should be consistent, and you need to make sure that you have a large percent of your population taking the survey. I mean, I would say if less than three quarters are taking it, you’re not really getting the right measures. So our survey at Toyota is really comprehensive. It has something like 70 or 80 questions on it. And with that kind of reach, you can ask things like, “Am I comfortable bringing my whole self to work?” Or, “Is my work environment inclusive for someone like me?”
And then of course we can filter on demographics and do all kinds of cuts, and you can really learn a lot that way. So that’s sort of at the macro level, but that’s sort of also like the quantitative side of it. But there’s another side, too. So a couple of years ago, we reorganized our whole DNI team at Toyota around the concept of diversity and inclusion consulting. So everybody on our team is assigned to a certain business unit, and they have relationships with all the executives in those business units, and through building those relationships, and having check-ins, and having the conversations, and looking at the data with those executives — both diversity and cultural inclusion data — they can really hone in on what the specific issues are. And with an organization like us, one size doesn’t fit all, because a manufacturing plant is not the same as a financial services office, for example.
So to get back to your question, yes, culture and inclusion are harder to measure, but it can be done. And if you have the four “buckets” of quantitative, qualitative, big picture and small business unit, and you have the relationships and conversations, I really do think you can get at it.
“That’s the work that we’re trying to do — to try to understand, “How am I going to see that something good can provide even better outcomes if I move a couple of levers?”
— Marcelo Bartollo, Americas Deputy Vice Chair of Counseling, EY
Johnson: Now, when we’re talking about these engagement surveys, Stephen, can you talk a little bit about how important organizational trust is? Because putting a survey out there just for the sake of doing it — that doesn’t really help. So can you talk a little bit about what we’re seeing with the level of organizational trust in the responses from these services?
Lewis: Yup. Well, it’s made very clear that there’s complete confidentiality. There is no way I could, if somebody wrote something about me, there’s no way any of us could find out what it is. And we reiterate that year after year after year. And it’s not administered by us, it’s administered by a third party, and the data goes into something other than a Toyota website. And so I think you have to communicate that, and you have to hammer it home, time after time, year after year, that this is anonymous. This is your chance to say what you really think. It’s confidential. And on top of that, if there’s a group smaller than 20 people, the leader doesn’t [have access to] the verbatim results, because it could be traceable. And when you make that clear, I think it builds confidence.
Johnson: So, Belinda, data is meaningless if you aren’t continually monitoring and tracking. What tracking processes does AT&T have in place to monitor DE&I data over a period of time? And what are you looking for when you’re analyzing this data? Can you share some examples with us?
Grant-Anderson: Absolutely. So we actually have a couple of different processes we put in place to make sure we’re tracking how we’re doing around DE&I. One of the first things we do is around our workforce demographics. We actually [compile] that data every year in our DE&I annual report. And we’ve been doing that since 2015. And so what that does is, it lets our entire organization see how we are performing over time when you look at women and people of color, and we’re actually talking specific race, and we’re also looking at our management versus non-management populations. And one of the things we did last year was, we took that big management bucket and we split it out to the senior leadership versus the rest of management. And that was very, very telling, because, as you know, a lot of times senior management isn’t as diverse as the rest of the organization.
And by putting that data out and making it visible to the entire organization, it really holds you accountable. And we’re going to start putting that out publicly as well, so that people can see, here’s how we’re trending, and here’s where we’re focused on trying to get better.
The other thing we’ve done internally is, we’ve taken that same transparency and pushed it deeper into the organization. And so each quarter we put together what we call our quarterly progress report, and we give it to all of our officers and senior managers, and they get a glimpse of, here’s what your organization looks like this quarter, and how it’s been trending over time. And that report includes, here’s what your demographics look like; by level, here’s how you’re hiring; here’s what attrition looks like; here’s the kind of movement you have. Because we want to make sure people aren’t getting stuck. Here’s the kind of promotions you’re seeing. We also look at, what do your top talent or your high-potentials look like? Who’s being lifted up to go into development programs?
So all of that data we actually make available to those leaders so that they can see what their organization looks like and how they’re trending over time. We think that’s really critical. The other thing we do, very similar to what Stephen was just talking about, is that annual culture survey. So every year we have a culture survey, and in that survey, we’re asking questions like, “Do you think the leadership is committed to DE&I?” “Is your supervisor bringing in diverse people and perspectives as you’re making decisions?” And, “Do you think that this company has enough diversity and diverse perspectives to be successful?”
And so that’s actually helping us then see, are we making progress? And then we make that data available, we push that down into the organization so that people can see how they look relative to the overall company. But then they can also see how they are trending over time, so that you, as a leader can then say: Where do I need to focus in my organization? Wanting to make sure I’ve got the right people, I’m developing the right people, I’m moving people. And I’m also building that culture that I need in order for people to feel that they belong and that they can be successful.
Johnson: Yeah. And as a Hall of Fame organization, AT&T — and also EY — that is one of those best practices that we often look at, based on what you all are doing. And then we share through webinars, and also content on diversity best practices. So you are always an organization we watch to get a better understanding of how to do this well. So Alveda, I want to come back to you. There are so many ways data can be analyzed and leveraged to improve a culture. What are some of the best practices you use to collect and analyze DE&I data?
Williams: I would probably echo some of the things we heard from both Stephen and Belinda. At Dow, we’ve built what we call a balanced scorecard — balanced in the sense that it includes both diversity and inclusion metrics. And we’re pretty clear, as I mentioned before, about not measuring just for measurements’ sake, but it really is to drive progress. And so everything that is part of our scorecard has a direct link back to our overall inclusion and diversity strategy. For example, for deep ERG engagement, we analyze the data and we report out on our data and our progress quarterly to the entire organization. But in addition to scorecards, we actually have also created dashboards. The dashboards allow us to actively look across the company for differences, and understand where we might target.
The focus on dashboards is really on the leading indicators. And the scorecard is about the overall outcomes. Another best practice that we have that I know other companies use is around data visualization techniques, which really allow us to pinpoint where we might have some bright spots in our organization or even some hot spots. That allows us to say where in our own company, across all the different sites and locations and businesses and functions, do we have bright spots? Internal best practices that we can leverage across. And then hot spots — where do we have an opportunity perhaps to intervene and really try to drive a meaningful change and close gaps? Like the other companies, we have, again, employee surveys that give us an idea of how we’re doing with respect to our culture.
We’ve also introduced pulse surveys to get more relevant data in a more timely fashion. The thing that I would add to that, in addition to what’s already been mentioned, is that we actually couple our annual survey with a leadership effectiveness survey. In this case, each employee has the opportunity to give feedback on their leader. And that’s actually really important when you think about culture. Because the data will tell you that more than half of an employee’s experience is — especially with respect to inclusion and diversity — connected to their experience with their leader. And so employees get the opportunity to give input, and leaders get the gift of feedback and an opportunity to connect that feedback to a meaningful action plan.
“As we go forward in this space, our actions and our outcomes are simply going to have to align.”
— Alveda Williams, Corporate Director of Inclusion, Senior HR Director of Talent Acquisition, Dow
Johnson: So when we talk about leadership accountability, one of the things I specifically remember is Jim Fitterling, [Dow’s] CEO, participating in the debrief and asking questions just very clearly: “Why are we?” or “Why aren’t we?” And so I think when we’re talking about this information — it clearly being seen and then being challenged and supported to be improved — is extremely important. And so with that, segue into the last question for everyone: With all of the voluntary data disclosures, specifically workforce data disclosures, where do you all see the diversity, equity, inclusion and belonging data analysis in the future? Where are we heading?
Bartholo: Today we have data that tells us not only how people perform, but how they feel about being within the organization. That’s available right here, right now. I think we’re heading into a place where we can actually then become predictive with the analysis. That’s the work that we’re trying to do — to try to understand, “How am I going to see that something good can provide even better outcomes if I move a couple of levers?” And just as importantly, “How can I see some issues coming around the corner?”
I think we do a really good job of analyzing data at a point in time and trying to project it into the future. With technology, we can actually write algorithms that are going to predict the future for us, and we can then control our own destiny around DE&I in a bigger way. And I really think we’re very close to that point in time.
Johnson: Belinda, drilling down a little bit around that, what are any potential risks associated with where we’re heading when we’re looking at the data this way?
Grant-Anderson: So I’ll talk about the risk a little bit first, and then go into sort of where we’re headed. I do think that it’s critical that we continue to do this work because the data is important. You can’t make decisions without the data. But there is an issue that we just need to make sure that we’re careful about because we do sometimes run the risk of leaders really losing sight of what we’re trying to do and just focusing on trying to meet a number. And when people are trying to meet a number, you can really have some of those bad behaviors, right? That come up around bringing people in just for the sake of bringing them in, and not really been focusing on the fact that what we’re trying to do is to really build this diverse, highly skilled, highly effective workforce.
And so, because of that risk, it’s just really important for us to make sure we’re spending time and partnering with our business partners, that we’re really spending time with our clients so that we have our ear to the ground and we really know what’s going on and can intervene before some of these behaviors take root and actually cause a problem. So I think that’s one of the things we have to guard against.
Now, in terms of where I think we’re headed, I absolutely agree with Marcelo. I think we’re really headed into this world of being able to predict. One of the things I’m hopeful we’re also headed into is the ability to really understand and get some great benchmarks, because I think it’s important for us to be able to answer this question of, “What does great look like?” so we can get some really good benchmark data and know what the ultimate goal is. Not so much the goal, but what we’re trying to head toward. That’s just going to help us bring more people in, and be supportive as we go along on this journey. So that’s where I would go.
Johnson: Stephen, where do you see DE&I data analysis heading in the future?
Lewis: You know, if you look even broader, I think that the concept of transparency is a megatrend that we’re in. I was reading an article just the other day that said that younger people have no problem sharing their salaries with each other — which, for me, that’s just unheard of. So I think we’re going to see changes, and I think we’re on a path of ever more transparency. I’ve seen at Toyota, we’re sharing more data than we ever have before. But it’s not totally transparent — for very good reasons like we just heard. But I don’t think we can stop the transparency trend.
Johnson: And it has to be standardized transparency, because a lot of organizations are just trying to put something out there for the sake of saying, “Well, we shared our numbers.” But if we’re all calling it something different, does that really help, from a transparency perspective? But also from a benchmarking perspective? And so with that, Alveda, final word: Where are we headed?
Williams: Listen, I would say as an answer, we could probably drop the mic on your comment. I agree with the other panelists. I think that predictive analysis is the future. I think there are some new technical approaches to DE&I analysis that are evolving as companies try to better understand the impact that their IND work is having and look for better ways to measure inclusion.
But I would certainly agree. I think the future is here, I think it’s now. If you think about the fact that we’re here today, having a conversation on data transparency and accountability, that is going to continue to be elevated as an expectation and not just a “nice to do” for companies and organizations. I say, gone are the days of statements and good faith efforts around DE&I. The world, rightfully so, is challenging us and demanding real and measurable progress.
And so, we talked about ESG, we’ve seen the rise and importance of that — the growing pressures that our company and others are facing with respect to measuring and reporting progress. And I’ll tell you, we have made some public commitments in each of these areas. And we know now that we’ve been out there, we’ve given our employees, our communities, our customers, our investors, a guidepost by which to measure us, and to hold us accountable. And so I think that in the future, as we go forward in this space, our actions and our outcomes are simply going to have to align.
Johnson: I’d say that that was a drop-the-mic statement as well, and a powerful way to end it. So folks, thank you so much for your participation today.


